
Introduction
The Law of demand refers that when the price increases then the quantity demanded of that commodity decreases and vice-versa, other things remain the same. There is an inverse relationship between the price and quantity demanded, with other things remaining constant or the same. And the law of supply states that when price increases, its supply at that increases, and when its price decreases its supply decreases, other things remain the same. There is a positive relationship between the price of a commodity and its supply at that price, with other things remaining constant or the same. This article introduces the theory or law of supply and demand. It considers how buyers and sellers behave and how they interact with one another. It shows how supply and demand affected by prices in a market economy.
The term ‘Other things remaining same or constant’ refers to the hypothetical situation in which some variables assumed to be constant.
The buyers as a group determine the demand for the product, and the sellers as a group determine the supply of the product. Let’s discuss how buyers and sellers behave in the market.
law of demand and supply definition
Law of Demand
The Law of demand describes the relationship between the price and quantity demand or consumption of particular goods and services. The Law of demand states that when the price increases then the quantity demanded of that commodity decreases and vice-versa, other things remain the same.
It means the law of demand shows an inverse or negative relationship between price and quantity demanded of a commodity, other things remaining things. This is because an individual or consumer wants to purchase more quantity of goods and services at a lower price and less quantity of goods and services at a higher price.
Assumption of Law of Demand
- No change in taste, preferences, and fashion of the consumer
- No change in the income level of the consumer
- The price of related goods not be changed
- No change in population size
Demand Function
Demand function refers to the functional relationship between the Demand for the commodity and its determinants. Symbolically, demand for a commodity can presented in the functional form as;

Do you want to know more about other determinants as mentioned above i.e income, price of related goods, advertisement etc. Read More
Law of Supply
The Law of supply states that when price increases, its supply at that increases, and when its price decreases its supply decreases, other things remaining the same. There is a positive relationship between the price of a commodity and its supply at that price, with other things remaining constant or the same.
This is because of the profit motive of the firms. If there is a low price, the firm earns less profit. On the contrary, a higher price may provide higher profit to the firms which encourages them to supply more at that price.
Assumption of Law of Supply
- No change in the technology of production
- No change in government taxation and subsidies
- The price of raw mater not be changed
- Future expectations should be avoidable by the producer
Supply Function
Supply function refers to the functional relationship between the supply of the commodity and its determinants. Mathematically, supply function expressed as;

law of demand and supply with examples
Note that, buyers as a group determine the demand for the product, and the sellers as a group determine the supply of the product. Let’s discuss how buyers and sellers behave with changes in price.
Law of Demand Examples:
If you know that the price of tea has doubled in a tea shop, what will you do? You may cut back on the number of cups of tea you drink, say from five cups per day to three. Perhaps, you will give up drinking tea together. In other words, with the rise in the price of a particular product, the demand decreased. It shows there is a negative or inverse relationship between demand and price.
Law of Supply Examples:
If the price of the biscuit rise, it encourages the producers to produce more units of biscuit to earn greater profit. As a result, supply rises in the market. In other words, with the rise in the price of a particular product, there is an increment in the supply of that product. It shows that there is a positive relationship between the supply and the price of the commodity.
explain the law of demand with a diagram
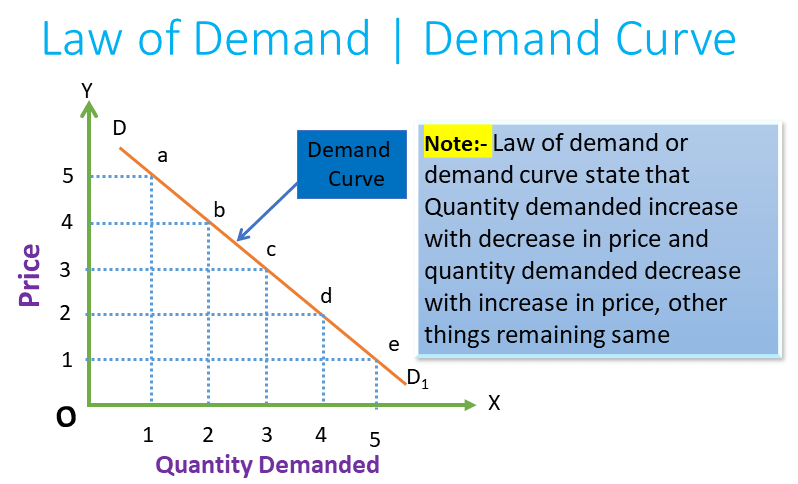
In the given figure, price and demand measured on Y-axis and X-axis respectively. DD1 curve is the demand curve which formed with the summation of the coordinates a, b, c, d, and e respectively.
In the figure, we can see that when the price is Rs. 5 then quantity demand is 1 at ‘a’ point, and when the price decreases to 4, 3, 2, and 1 respectively then the demand also decreased to 2, 3, 4, and 5 respectively. In other words, when the price falls, quantity demand increases and vice-versa. There is an inverse relationship between them so the demand curve always downward slope from left to right.
This figure shows the relationship between the price of a good and the quantity demanded, holding constant everything else that influences how much good consumers want to buy.
Frequently Asked Questions (FAQ)
Why does the demand curve for a commodity slope downward from left to right?
When the price of a commodity falls, its quantity demand increases, and vice-versa, other things remain the same. It is due to the operation of this law of demand that the demand curve slopes downward to right. There are two factors due to which the demand curve slopes downward (demand increases when price falls and vice-versa).
- Income Effect:
- Substitute effect
Income Effect
When the price of a commodity falls, the consumer can buy more quantity of the commodity with his given income or if he chooses to buy the same amount of quantity as before, some income will left with him because he has spent less on the commodity due to its lower price. In other words, his real income increases due to a fall in the price of the commodity (Real income=Nominal income/price level). This increase in real income makes him feel wealthier than before. This induces him to buy more of that commodity. This called the income effect of the change in the price of the commodity.
Substitution Effect
When the price of a commodity falls, it becomes relatively cheaper than other commodities. This induces the consumer to substitute the commodity whose price has fallen or which is cheaper than the expensive one. As a result of this substitute effect, the quantity demanded of the commodity, whose price has fallen rises.
Distinguish between demand and quantity demand.
Demand represents the whole demand schedule or curve which shows the quantities of a commodity demanded at various prices. On the other hand, quantity demanded refers to the particular quantity which consumers buy at a particular price.
Explain Law of Supply with a Diagram
In the given figure, price and demand are measured on Y-axis and X-axis respectively. SS1 curve is the supply curve.
In the figure, we can see that when the price is Rs. 60 then, the producer or supplier wants to supply or sell 400 units of goods. When the price decreases to 40, 20, and 10 then the seller supplies 300, 200, and 100 unit of goods respectively. It shows that when price falls, supply of the goods falls and vice-versa.

Demand and Supply Equilibrium
What is Demand and Supply equilibrium or Market equilibrium?
The word equilibrium means a state of balance. Here demand and supply equilibrium means a situation in which demand and supply have brought into balance (Demand=Supply). It is also known as market equilibrium. If we have to define market equilibrium or demand and supply equilibrium an economistic point of view, a market is equilibrium, when no one (either seller or buyer) in the market has any reason to change their behavior so that there is no tendency for production or prices in that market to change.
Understanding Demand and Supply Equilibrium (Market Equilibrium)
To determine the price at which a good will sell (the equilibrium price) and the quantity of it that sold (the equilibrium quantity), we have to plot the demand curve and supply curve in a single graph. The point where when both the demand and supply curves intersect each other, this point known as the market equilibrium point. And the corresponding quantity and price are known as equilibrium quantity and equilibrium price respectively.
Equilibrium price: the price at which quantity demanded and quantity supplied is equal (Qd=Qs)
Equilibrium quantity: the quantity supplied and the quantity demanded when the price has adjusted to balance supply and demand.
The equilibrium quantity and price of a product are the values that correspond to the intersection of the supply and demand curves for that product. Market equilibrium occurs when all buyers and sellers are satisfied with their respective quantities at the market price.
Note that the limited sense of the term; satisfied in the definition of market equilibrium. It doesn’t mean that seller would not pleased to receive a price higher than the equilibrium price. Rather, it means only that they’re able to sell all they wish to sell at that price. Similarly, to say that buyers are satisfied with the equilibrium price doesn’t mean that they are not happy to pay less than the equilibrium price. Rather. It means only that they’re able to buy exactly as many units of the good as they wish to at the equilibrium price. (Frank, principles of economics)
Mathematically, demand and supply equilibrium explained through equation;

Demand and Supply Equilibrium with diagram
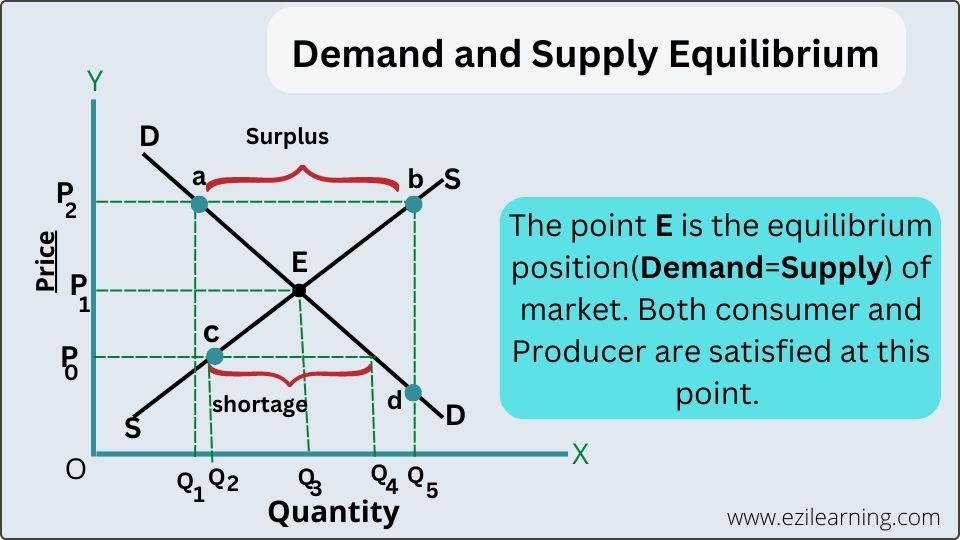
In the above figure, quantity and supply represents on X-axis and Y-axis respectively. E is the point where the market is equilibrium or demand and supply equilibrium. Beyond E point, either seller or buyer is dissatisfy.
Both buyer and seller satisfy to buy or sell respectively at quantity Q3 and price P1 i.e. point E. The Q3 known as quantity equilibrium and p1 known as price equilibrium. Beyond point E, either buyer or seller may not satisfied on the market. See in the graph, if the customer or buyer wants to buy Q1 quantity of goods i.e. point a but at the same time the seller wants to sell Q5 quantity of goods i.e. point b at price P2, the seller is dissatisfied. The excess amount of goods the seller wants to sell known as surplus or excess supply.
Similarly, beyond it, if the seller wants to buy Q5 quantity of goods i.e. point d but at the same time the seller only wants to sell it goods up to Q2 i.e. point c, the buyers dissatisfied. The excess amount of goods the buyer wants to purchase known as shortage or excess demand. In order for both of them to be satisfied, they have to purchase(by buyer) and sell(by the seller) a quantity of goods at point E.
Key point to Remember under market equilibrium
Excess supply, or surplus- the difference between the quantity supplied and the quantity demanded when the price of a good exceeds the equilibrium price. Sellers are dissatisfied when there is excess supply.
Excess demand or shortage- the difference between the quantity supplied and the quantity demanded when the price of a good lies below the equilibrium price. Buyers are dissatisfied when there is excess demand.
Equilibrium- equilibrium means a situation in which demand and supply have brought into balance (Demand=Supply).
Unless presented by regulation, prices and quantities are driven toward their equilibrium values by the actions of buyers and sellers. If the price is initially too high, resulting in excess supply, dissatisfied sellers will cut their prices to sell more. If the price is initially too low, which leads to an excessive amount of demand, buyers’ competition drives the price up. This cycle is constant until the balance is reached. (Frank, principles of economics p.no. 85)