
Introduction
The law of variable proportion was first introduced by the economists like Joan Robinson, Alfred Marshall, Benham, etc. This law only applies to short-run production functions. This law reveals the total effect on output with a proportionate variation in one variable input (i.e. Labor) with the constant unit of fixed cost/inputs. This law says when we put one extra unit of the variable input (labor) then the productivity of this input (labor) is less than the previous unit of labor. In other words, the marginal productivity of the variable factor is declining when we increase the variable factor.
Definition of Law of Variable Proportion
According to Benham
“As the proportion of one factor in a combination of factors is increased after a point, first the marginal product and then the average product of the factors.”
According to the law of variable proportion, when the quantity of variable factor increased keeping other factors constant, the total product increases at the increasing rate initially, but after a point increases at decreasing rate becomes maximum, and finally declines/falls. It examines the production function with one variable input, keeping the other constant. This law explains three effects on output (i.e. increasing return, diminishing return, and negative return) when we continue increasing the variable factor keeping other fixed factors constant in the short run. We discuss these three effects below. First, we must know about the assumption of this law.
Assumption of Law of Variable Proportion
- Technology remains constant
- At least, one factor of production remains constant
- It is possible to make a proportionate change in the use of variable inputs with the use of fixed inputs.
Explanation of Law of Variable Proportion:
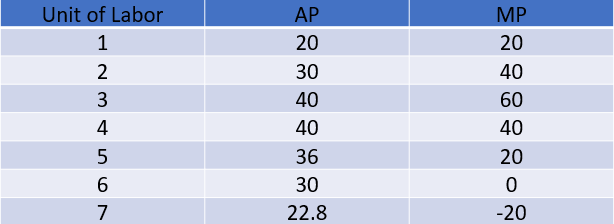
Let’s discuss the law of variable proportion in the short run through the below table/Scheduled. We already know that in the short run capital is fixed and production only depends upon the variable factor (Labors). So, we only include units of labor in the below table.

Stage I: Stage of Increasing return
In the above table, we see that when the unit of labor increase from 0 to 1 then the Total product increase from 0 to 20, the Average product increase from 0 to 20, and the Marginal Product increase from 0 to 20. In a similar manner, when the unit of labor increase from 1 to 2, 3, and 4 then the Total product increase from 20 to 60, 120, 160 respectively. And the Average Product increase from 20 to 30, 40, 40 respectively, and also marginal product increase from 20 to 40, 60, 40, respectively.
From this, we can see that when 1 unit of labor increases then TP, AP, and MP increase more units than the preceding one. In this stage, every product (TP, AP, and MP) is in the increasing stage. Labor productivity is at an increasing rate so it is known as the stage of increasing return.
Stage II: Stage of Decreasing return
In the above table, we see that when the unit of labor increase from 4 to 5 and 6 then TP increases from 160 to 180 respectively and becomes maximum. But it slowly increases from the previous one, AP decrease from 40 to 36, and 30, and Mp decrease from 40 to 20, and finally become zero. In this stage, labor productivity is at a decreasing rate so, it is known as the stage of decreasing return.
Stage III: Stage of Negative Return
In the above table, we see that when the unit of labor increase from 6 to 7 then TP decrease from 180 to 160, AP decrease from 30 to 22.8, and MP decrease from 0 to -20. When units of labor increase in this stage, then the productivity of labor goes on negatively.
Let’s discuss it also through the diagram for a more clear understanding of law of variable proportion
Law of Variable Proportion with Diagram
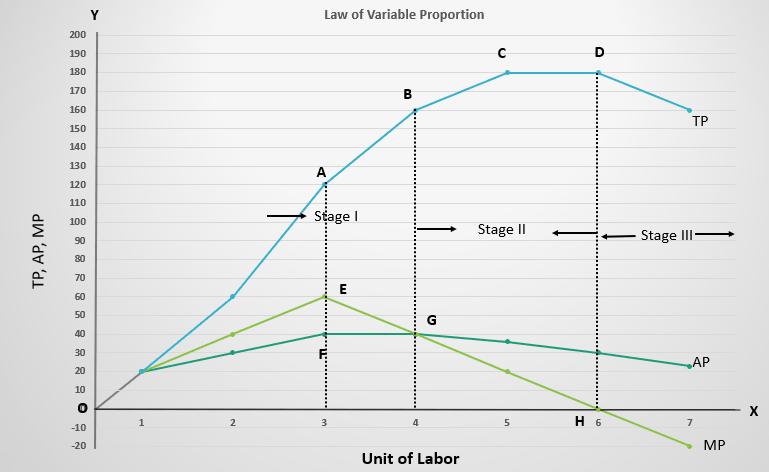
Stage I: Stage of Increasing return
In Stage I, TP increases at an increasing rate up to point A and then increases at a decreasing rate. MP increases, become maximum at point E, and go on dealing. From the above, we also conclude that when MP is in the increasing stage, TP increases at an increasing rate and when MP is being to decline then TP increases at decreasing rate. And AP increases and becomes maximum at the G point where AP and MP intersect with each other.
Stage II: Stage of Decreasing Return
The above diagram shows that in Stage II- TP becomes maximum at point D where MP becomes zero and AP is in declining stage.
Stage III: Stage of Negative Return
The above figure shows that TP finally declines from the D point where MP becomes negative but AP is declining but never becomes negative.
Relationship between Marginal Product and Average Product
The relationship between Marginal Product and Average Product explain in the below table and graph.
The above table plot the graph to know a clear picture of the relationship between Marginal product and Average Product.

The above figure shows that when the Average product increase, the marginal product also increases to the right. It can be observed at the input range of labor from 1 to 3. When the average product reaches the maximum and constant then the Marginal product decrease to point B (at maximum and constant point ie. 4 units of labor). After that both MP and AP decrease but MP goes on negative and AP remains positive. It means that AP never becomes negative.
Summary of the relationship between Average Product and Marginal Product
- When AP increases, MP also increases with a greater rate and MP lies above the AP
- When AP decreases, MP also decreases with a greater rate and MP lies below the AP
- MP curve cuts AP when AP is at maximum or constant then after AP decreases
- MP curve becomes negative but AP product remains positive
Relationship between total product and marginal product
The relationship between Average Product and Marginal Product explains in the below table and graph.

Graphically representation of Relationship between total product and marginal product.

The above figure shows that when MP increases. TP increases at an increasing rate. TP increases at an increasing rate from 1 unit of labor to 3 units (ie. A point). At the point MP declines, TP increases at decreasing rate. We can see these from the employment of 3 units of labor to 6 units (i.e. From A to B points). TP becomes maximum at 6 units of labor employment where MP becomes Zero. TP declines after the B point where MP goes on negative.
Summary of Relationship between total product and marginal product;
- MP increases, TP increases at an increasing rate
- When MP declines, TP increases at decreasing rate
- When MP becomes zero, TP become maximum
- At MP goes on negative, TP declines
Frequently Asked Questions
When the law of variable proportion valid?
The law of variable proportion is valid in short-run production
According to law of variable proportion, in which stage would a firm like to operate?
A rational consumer would like to operate their firm at the second stage where the firm obtains maximum production (TP)
What is law of variable proportion?
According to the law of variable proportion, when the quantity of variable factor increased keeping other factors constant, the total product increases at the increasing rate initially, but after a point increases at decreasing rate becomes maximum, and finally declines/falls.
Assumption of Law of Variable Proportion
1. Technology remains constant
2. At least, one factor of production remains constant
3. It is possible to make a proportionate change in the use of variable inputs with the use of fixed inputs.
You also want to read;