
This article includes the most important financial ratios that investors, analysts, or students of finance should know. Through the help of this financial ratio, You can find the financial health of any company or firm. For the simplicity of the reader, we provide the cheat sheet and pdf of this article at the last of this article.
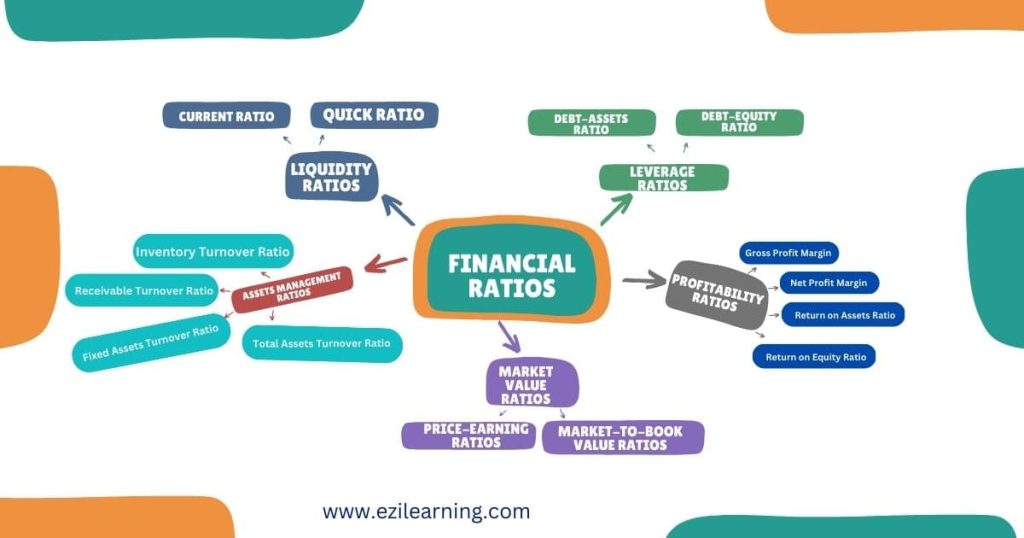
Table of Contents
Introduction
The financial ratio refers to the comparison of two accounting figures or data, generally from financial statements i.e. income statements, and balance sheets. And, Financial Ratio analysis is the process of analyzing these ratios by properly establishing quantitative relationships between their items. The reason behind the financial ratio analysis is to compare the strength and weaknesses as well as the financial health and stability of the firms with other competitors or within the organization through one accounting period to another.
It is one of the relative measurements or tools in the field of finance or accounting. There is no standard ratio value that indicates the companies are in a good position or in a bad one. It means to say that if you want to measure the financial health of your firms or organizations, you have to compare it to your competitors in the markets or with the industrial average. If you are better then your companies are in a good position.
Why financial ratios are important?
A financial ratio is important to every financial analytics, specialist, or finance-related person for the following reason:
- Financial ratios are used to analyze a firm’s past performance and assess its strength and weakness.
- Helps the decision makers to make a better decision
- Helps to forecast future opportunities and challenges.
- Helps the stakeholders to identify the financial position of the organization and compare it with other organizations in the same industry.
- Evaluate the trends in the firm’s financial position over time.
Types of Financial Ratio
Broadly, financial ratios are categorized into 5 types;
| Types of Ratio | Definition |
|---|---|
| Liquidity Ratio | Ratios that measure the firm’s ability to meet its short-term liability in the short-run |
| Leverage/Debt Management Ratio | Ratios that measure the firm’s ability to meet its long-term liability |
| Assets Management Ratios | Ratios that measure how effectively and efficiently firms manage their assets |
| Profitability Ratio | Ratios that measure the profit-earning capacity of the firms |
| Market Value Ratios | Ratios are used to assess a firm’s stock price in relation to its earnings and book value of shares. |
These above financial ratios are the most important when you are trying to identify the strength and weaknesses of companies or firms.
Interpretation of Ratios
Although it is a complex task to find out whether the ratio that the company obtained is good or bad. It does not provide any meaningful information in absolute terms. It must be compared in relative terms i.e. compared with the relevant standards.
There are mainly three ways to interpret ratios.
- Compare the company’s ratio with the industry average
- Compare with the historical data and analyze it
- Compare with the ratios of competitors for the past and present.
Note: In this article, we explain each ratio with respect to the industry average in the interpretation section.
Lets’ discuss the 5 most important financial ratios briefly,
Liquidity Ratios
Liquidity ratios are the ratios used to measure a firm’s ability to meet its short-term solvency position. In other words, it deals with the question of how well the firm is able to meet its current obligation. The two primary ratios are used to test the firm’s liquidity condition. They are:
- Current Ratio
- Quick Ratio
Current Ratios
The current Ratio measures the firm’s ability to pay off its short-term obligation. It shows the firm capacity to pay the current obligation or current liabilities from its current assets. It is calculated by representing the quantitative relationship between current assets and current liabilities. Expressed as; dividing current assets by current liabilities.

Let’s Take an example of how to calculate Current Ratios:
Morang Manufacturing company has current assets of $800000 and current liabilities of $500000. Calculate current assets.
Solution:
[latex]Current\;Ratio=\frac{Current\;Assets}{Current\;Liabilities}\\\\=\frac{\$800000}{\$500000}\\\\=1.6\;Times[/latex]Interpretation: The unit of measurement of the current ratio is either dollars or times. Thus, the Current ratio of $ 1.6 implies that for every $1 of current liabilities, the company has $1.6 of current assets to bear in the short run (within 12 months). In other words, the Firm has 1.6 times more current assets to bear the current liabilities.
Quick Ratio
While calculating the current ratio, we involve inventory which is often the least liquid asset. It can’t easily be converted into cash in a very short period of time. So by excluding inventory, we compare the current assets and current liabilities called the quick ratio. By excluding inventory from current assets, also known as quick assets. So we can define the Quick ratio as the type of financial ratio that measures the firm ability to meet short-term solvency in a very short period of time. In other words, It measures the firm short-term capacity to meet its obligation without relying on the sale of inventories. It is also known as the acid-test ratio or liquid ratio.

Let’s take an example;
Information of the company(from Balance Sheet):
| Current Assets | Current Liabilities |
|---|---|
| Receivable=$15000 | Payable=$2200 |
| Cash=$25000 | Outstanding wages=$43000 |
| Inventory=$17000 | |
| Marketable securities=$13000 | |
| Total current Assets=$70000 | Total Current liabilities=$45200 |
Solution:
[latex]\mathrm{Quick}\;\mathrm{Ratio}=\frac{\mathrm{Current}\;\mathrm{Assets}-\mathrm{Inventory}}{\mathrm{Current}\;\mathrm{Assets}}\\\\=\frac{\$70000-\$17000}{\$45200}\\\\=\frac{\$53000}{\$45200}=\mathbf1\boldsymbol.\mathbf{17}\boldsymbol:\mathbf1\boldsymbol\;\mathrm{or}\;\mathbf1\boldsymbol.\mathbf{17}\;\mathrm{Times}\\[/latex]Interpretation: The unit of measurement of the quick ratio is either dollars or times. Thus, the quick ratio of 1.17 implies that the firm has 1.17 times more liquid assets that are quickly converted into cash to cover its current liabilities. In other words, it means that the firm has $1.17 quick assets to bear every $1 of its current liabilities immediately.
Why inventories are not included in the Quick ratio calculation?
Inventories are not included in the Quick ratio calculation because inventories have the least liquidity among all the other current assets. Besides it, these asset losses are most likely to occur in the event of liquidation. Therefore, measuring short-term solvency without relying on the sale of inventories is significant. Quick ratio implies the ability of firms to meet their immediate obligation.
What is considered a high liquidity ratio?
The liquidity ratio is the financial ratio that measures the ability of the firm to meet its short-term obligation. A high liquidity ratio is good for the firms. It gives the positive message that firms can meet their liabilities within the short-run(usually within one year accounting period) But having a very high ratio implies a negative message because having a high liquidity ratio implies that firms are not investing in new projects or signals inefficient use of current assets. A lot of cash or cash equivalent of the firm remains ideal. And as we know that ideal money earns nothing. Thus, there is less chance of growth and expansion in those firms. So, the firm should have only to maintain the industry average ratio.
How do you interpret the current ratio of 2:1?
The current ratio of 2:1 implies that the firm has doubled of current assets to bear its current liabilities i.e., short-term liability.
How do liquidity ratios help investors and creditors make decisions?
Generally, the liquidity ratio is calculated by investors and creditors to find out its short-term liquidity position and determine whether the firm is able to pay its short-term obligation with its cash or near cash assets (cash equivalent assets) in case of unexpected events like economic downturn, sudden drop in revenue, etc.
Leverage or Debt-Management Ratios
Leverage ratios are intended to address the firm’s long-run ability to meet its obligations or, more generally, its financial leverage. This ratio measures the firm’s ability to pay its interest regularly and to repay the principal on the due. This ratio also measures the extent to which the firm is using debt financing or financial leverage. Leverage ratios are also known as debt management ratios.
The leverage or long-term solvency of a firm can be measured by two following ratios;
- Debt ratio and,
- Debt to equity ratio.
Debt Ratio
The debt ratio is also known as the debt-assets ratio. This ratio measures how the firm is using borrowed funds to finance its assets. It is calculated by dividing the total debt by the total assets. If you want to measure the firm solvency in the long run, in such a condition you can calculate it by dividing the long-term debt by total assets.
Formula to calculate Debt-Assets Ratio:
[latex]\mathrm{Debt}\;\mathrm{Assets}\;(\mathrm{DA})\;\mathrm{Ratio}=\frac{\mathrm{Total}\;\mathrm{Debt}}{\mathrm{Total}\;\mathrm{Assets}}\\\\\mathrm{where};\\\\\mathrm{Total}\;\mathrm{Debt}=\mathrm{Total}\;\mathrm{Assets}-\mathrm{Total}\;\mathrm{Equity}\\\\\\\\[/latex]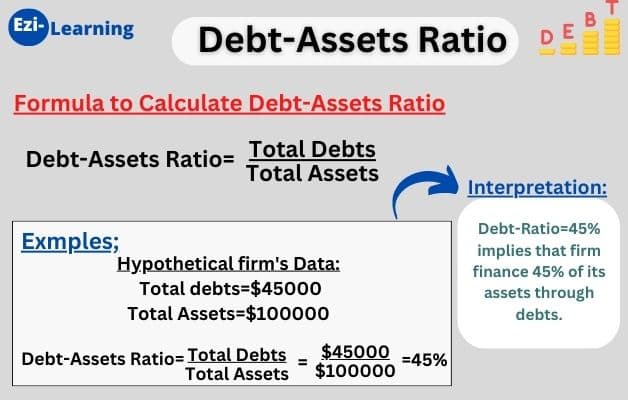
Interpretation: Debt-to-assets ratio=45% or 0.45 implies that firm finance 45% of its assets through debts. It obviously implies that the owner has provided the remaining finance i.e. 1-0.45=0.55 or 55% of assets.
A low debt-to-assets ratio indicates the use of more equity than debt which means larger safety of margin for creditors because shareholders’ equity is considered as a margin of safety by creditors and vice-versa.
Debt to Equity Ratio
The debt-to-equity ratio measures the proportion of assets financed by debt relative to the shareholder’s equity. This ratio describes the lender’s contribution for each rupee of the owner’s contribution. It is also called the debt to shareholder’s fund ratio. This ratio helps the investors and analysts to evaluate the firm’s or company’s financial health and risk profile.
It can be calculated by dividing the Total Debt by the Total equity. But some analytics prefer to use long-term debt divided by total equity because it provides a more clear picture of the company’s financial health in the long run.
Formula to calculate Debt-Equity Ratio
[latex]\mathrm{Debt}-\mathrm{Equity}\;(\mathrm{DE})\;\mathrm{Ratio}=\frac{\mathrm{Total}\;\mathrm{Debts}}{\mathrm{Total}\;\mathrm{Equity}}\\\\\mathbf{where}\boldsymbol;\\\\\mathrm{Total}\;\mathrm{Debts}=\mathrm{Long}-\mathrm{term}\;\mathrm{Debts}+\mathrm{Current}\;\mathrm{Liabilities}\\\\\mathrm{Total}\;\mathrm{Equity}=\mathrm{Total}\;\mathrm{Assets}-\mathrm{Fictitious}\;\mathrm{assets}-\mathrm{Total}\;\mathrm{Debts}[/latex]
Interpretation: Debt-to-equity ratio= 3 times implies that lenders contributed 3 times more than the owner’s contribution in the firm’s net assets. In other words, the lenders contribute $3 relative to each dollar of the owner’s contribution.
A high debt-equity ratio represents that a company or firm finance major of its assets through debts that considers risker by creditors or investors or lenders. There is more risk in investing in such firms and vice-versa.
Assets Management Ratios
The assets management ratio is one of the financial ratios which measure how effectively the firm manages its assets. This ratio helps to identify the level of investment in the assets with the level of current operation or level of generating sales. It answers the question ‘Does the firm has a high, low, or reasonable level of investment in assets for current operation?’. Assets management ratios are also known as turnover ratios or activity ratios or efficiency ratios.
If the investment in assets is high, there is a more chance of assets remaining ideal. There is no cash flow in the firms due to investment in ideal assets which seems to be a bad investment.
Interpretation: If the assets management ratio or turnover ratio is 5 times. It means each dollar invested in the particular assets generated 5 dollar worth of sales within a specific period of time.
Generally, companies always want to maintain a high turnover ratio. If any company has a high turnover or assets management ratio, it indicates that a company’s asset is performing effectively and efficiently and vice-versa. At least, A company always tries to maintain its minimum turnover ratio close to its industry average.
To know how effectively the particular nature of assets is utilized, we have to know about the following four financial ratios;
- Inventory Turnover ratio,
- Receivable Turnover ratio,
- Fixed assets turnover ratio
- Total assets turnover ratio.
Inventory Turnover Ratio
The inventory turnover ratio (ITOR) measures the firm’s ability to generate sales from its investment in average inventory. It implies the efficiency of firms in managing their inventories. It is calculated as the cost of goods sold divided by the average inventory.
Formula to calculate Inventory Turnover Ratio:
[latex]\mathrm{Inventory}\;\mathrm{Turnover}\;\mathrm{Ratio}\;(\mathrm{ITOR})=\frac{\mathbf C\mathbf o\mathbf s\mathbf t\boldsymbol\;\mathbf o\mathbf f\boldsymbol\;\mathbf G\mathbf o\mathbf o\mathbf d\mathbf s\boldsymbol\;\mathbf S\mathbf o\mathbf l\mathbf d}{\mathbf A\mathbf v\mathbf e\mathbf r\mathbf a\mathbf g\mathbf e\boldsymbol\;\mathbf i\mathbf n\mathbf v\mathbf e\mathbf n\mathbf t\mathbf o\mathbf r\mathbf y}\\\\\mathbf{where};\\\;\;\;\;\;\;\;\;\;\;\;\;\mathrm{Average}\;\mathrm{inventory}=\frac{\mathrm{Opening}\;\mathrm{stock}+\mathrm{Closing}\;\mathrm{Stock}}2\\[/latex]
Is a high inventory turnover ratio good or low?
A low inventory turnover indicates that a firm is holding excessive stock in the company and is unable to sell it out. Let’s discuss it briefly if there is low inventory turnover than the industry average; it means that you are investing an excessive amount in inventory. Thus, investment of excess amounts in inventory is unproductive and represents an investment with a low or zero rate of return. So, a high inventory turnover ratio is good for firms or companies.
Why cost of goods sold is appropriate than sales in calculating Inventory Turnover Ratio?
The cost of goods sold is more appropriate than sales in calculating the inventory turnover ratio because generally inventory is stated at cost price but the sales are stated at market price which overstates the true turnover. So the cost of goods sold (cost price of sales unit) is taken to calculate the inventory turnover ratio.
Receivable Turnover Ratio (RTOR)
The receivable turnover ratio measures the company’s effectiveness in collecting the number of credit sales. This ratio indicates the number of times the firm or company converts its receivables into cash during a year. Generally, the higher the value of debtors or receivable turnover, the more efficient the management of credit.
It is calculated by dividing the Annual credit sales by the average receivables. Formula to calculate Receivable Turnover Ratio:
- If credit sales and average debtor or receivable both can be calculated, in this case, net credit sales and average debtors are used to determine the debtors turnover ratio.
- If net credit sales and average debtors or receivables anyone cannot be calculated, in this case, net sales and closing debtors are used to determine the debtor turnover ratio.
whereas;
Debtor = Trade debtor+book debt+Account receivable+Bills receivable
(Note: Provision for doubtful debt is not deducted from the total amount of debtors)
[latex]\mathrm{Average}\;\mathrm{Receivable}=\frac{\mathrm{Opening}\;\mathrm{Receivable}+\mathrm{Closing}\;\mathrm{Receivable}}2\\[/latex]
Interpretation: Receivable Turnover ratio=2 times implies that the firm is able to collect its outstanding credit account 2 times in a year.
A high receivable turnover ratio indicates that a firm efficiently collects its account receivable or credit sale and has greater liquidity in accounts receivable. It is a positive sign for firms. Similarly, a low inventory ratio indicates that the firm is inefficient in the collection of account receivables. It indicates that the firm is making excessive investments in receivables and is unable to make a timely collection.
Fixed Assets Turnover Ratio (FATOR)
The fixed Assets Turnover Ratio measures how effectively and efficiently the fixed assets of the firms are utilized and generate sales revenue. A high fixed assets turnover ratio indicates the firm is using its fixed assets more efficiently as compared to other firms. It can be calculated by dividing sales by net fixed assets.
Formula to calculate Fixed Assets Turnover Ratio:
[latex]\mathrm{Fixed}\;\mathrm{Assets}\;\mathrm{Turnover}\;\mathrm{Ratio}=\frac{\mathrm{Sales}}{\mathrm{Net}\;\mathrm{fixed}\;\mathrm{assets}}[/latex]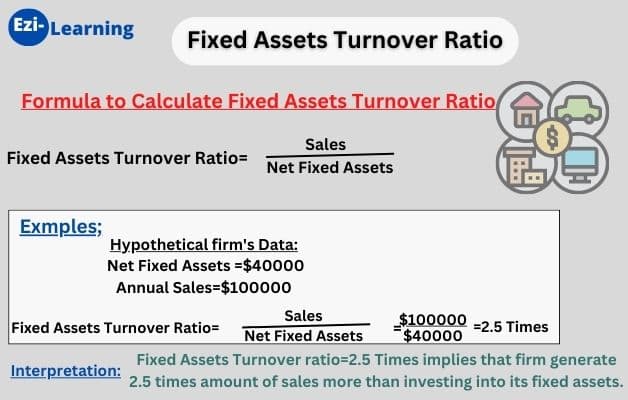
Interpretation: Fixed Assets turnover ratio=2.5 Times implies that a firm generates 2.5 Time amount of sales more than investing in its fixed assets.
The higher fixed assets turnover ratio reflects better utilization of fixed assets in generating sales revenue whereas the lower ratio indicates underutilization and poor management of fixed assets.
Total Assets Turnover Ratio
The Total Assets Turnover Ratio measures how effectively and efficiently the overall assets of the firms are utilized and generate revenue. Here the overall assets include net fixed assets plus Current Assets. It is calculated by dividing Sales by total assets.
Formula to calculate Total Assets Turnover ratio:
[latex]\mathrm{Total}\;\mathrm{Assets}\;\mathrm{Turnover}\;\mathrm{Ratio}=\frac{\mathrm{Sales}}{\mathrm{Total}\;\mathrm{Assets}}[/latex]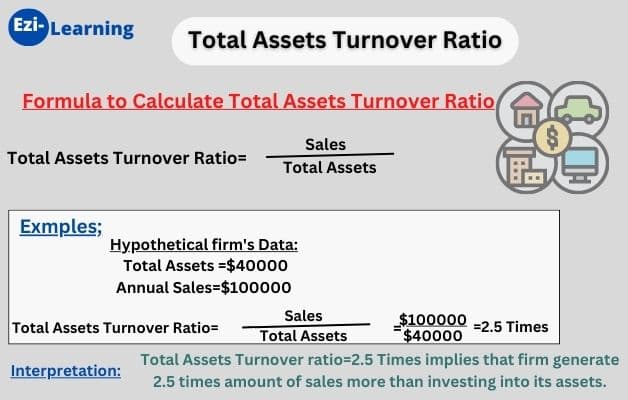
Interpretation:
Total Assets turnover ratio=2.5 Times implies that a firm generates 2.5 Time amount of sales more than investing in its overall assets.
The higher ratio reflects better utilization of overall assets whereas the lower ratio indicates underutilization and poor management of assets in generating revenue for firms.
Profitability Ratios
Profitability is the end result of a number of corporate policies and decisions. It tells the overall health, efficiency, and effectiveness of the operation of firms or companies. So investors and analysts calculate profitability ratios. We can define profitability ratios as the financial ratio which measure the overall operating efficiency of the company.
Is a high profitability ratio good or bad?
Obviously, a high profitability ratio is good but also consider that in the course of making the company more profitable or increasing the profit of the company, not forgetting to increase the level of satisfaction of customers or clients. It will hamper the company in the long run.
In this section, we discuss three ratios that are probably the best-known and most widely used ratios to measure the company’s profitability i.e,
- Gross Profit Margin
- Net Profit Margin
- Return on Assets
- Return on equity
Gross Profit Margin
The Gross Profit Margin measures the firm’s efficiency in generating gross profit with respect to sales. Here the gross profit means profit on sales after meeting the cost of goods sold. It is calculated by dividing Gross profit by sales.
Formula to calculate Gross Profit margin:
[latex]\mathrm{Gross}\;\mathrm{Profit}\;\mathrm{margin}=\frac{\mathrm{Gross}\;\mathrm{Profit}}{\mathrm{Sales}}\\[/latex]
Interpretation: Gross profit margin=0.4 or 40% implies that the firm earns 40% of gross profit on sales. In other words, we also say that on sales; 40% is the profit and the rest 60% is the cost of goods sold. In other words, we say that the firm earns $0.4 of gross profit for every $1 of sales.
A high gross profit margin relative to the industry average implies that the firm is able to generate higher gross profit relative to other competitors or firms. It is a sign of goods management and efficient utilization of resources or assets. On the other hand, a low gross profit margin indicates worse management in the firms and under-utilization of resources or assets.
Net Profit Margin
The Net Profit Margin measures the firm’s efficiency in generating net profit with respect to sales. Here the net profit means profit on sales after meeting the expenses incurred in the course of the firm’s operation including taxes and interest expenses. It is calculated by dividing net profit after tax by sales.
Formula to calculate Net Profit Margin:
[latex]\mathrm{Net}\;\mathrm{Profit}\;\mathrm{margin}=\frac{\mathrm{Net}\;\mathrm{Profit}}{\mathrm{Sales}}\\[/latex]
Interpretation: Net profit margin=0.6 or 60% implies that the firm earns 60% of net profit on sales. In other words, we also say that on sales; 60% is the net profit and the rest 40% is the cost incurred on manufacturing and operating the firms. On the other hand, we say, the firm earns $0.6 net profit for every dollar of sales.
A high net profit margin relative to the industry average implies that the firm is able to generate higher net profit relative to other competitors or firms. It is a sign of goods management and efficient utilization of resources or assets. On the other hand, a low gross profit margin indicates worse management in the firms and under-utilization of resources or assets.
Return on Assets Ratio
The return on assets ratio measures the overall effectiveness of management in generating profit (net profit) with its available assets. It can be computed by dividing net income after tax by total assets.
Formula to calculate Return on total assets:
[latex]\mathrm{Return}\;\mathrm{on}\;\mathrm{total}\;\mathrm{assets}=\frac{\mathrm{Net}\;\mathrm{Income}\;\mathrm{after}\;\mathrm{tax}}{\mathrm{Total}\;\mathrm{Assets}}\\[/latex]Sometimes net income after tax plus interest expenses is used instead of net income after tax to overcome the effect of non-operating expenses (i.e, interest expenses) to get a clear view of the company’s efficiency to generate an operating profit or profit from core business activities with respect to its investment in assets. In the course of calculating the company’s ability to generate net profit from its core business activities, we used the following formula;
[latex]\mathrm{Return}\;\mathrm{on}\;\mathrm{total}\;\mathrm{assets}=\frac{\mathrm{Net}\;\mathrm{Income}\;\mathrm{after}\;\mathrm{tax}+\mathrm{Interest}\;\mathrm{expenses}}{\mathrm{Total}\;\mathrm{Assets}}\\[/latex]
Interpretation: Return on Total Assets=0.3 or 30% implies that firms get 30% of the return from their investment in total assets. In other words, we say that the firm generates 0.3$ of profit for every dollar of investment in total assets.
Higher the return to assets ratio relative to the industry average, the more efficient the management in the utilization of total assets than its competitors or other firms on the market and vice-versa.
Return on Equity
Return on Equity measures the firm ability to utilize the owner’s fund in generating the firm’s profitability. It is calculated by dividing net income available after tax by shareholders’ equity or common equity. Here, the shareholder’s equity will include paid-up capital, share premium, and reserves and surplus less accumulated losses.
Formula to calculate Return on Equity:
[latex]\mathrm{Return}\;\mathrm{on}\;\mathrm{Equity}=\frac{\mathrm{Net}\;\mathrm{income}\;\mathrm{after}\;\mathrm{tax}}{\mathrm{Total}\;\mathrm{Equity}}[/latex]
Interpretation: The return on equity of 6% means that after meeting all expenses the firm has been able to earn a 6% return on its shareholders’ money or investment. In other words, we can say that for every dollar invested by the shareholder, the firm generates $0.6 dollar of profit
Higher the return-to-equity ratio, the more efficient the management and utilization of shareholder’s funds and vice-versa.
Market Value Ratios
The market value ratios measure firms’ overall performance or value relative to the current market price. These ratios are only used to analyze the public limited company. It is because these ratios required the market price of a stock for calculation which is only possible in a public limited company. The two are the most commonly used market ratios to analyze firms’ value relative to current market price. They are; Price-earning ratio and Market-to-book value ratio.
There are a number of factors that should be considered while working with this ratio. They are;
- Future growth opportunity
- Competition in the market
- Firms’ profitability
- Risk Profile of Firms
Price-Earning Ratio (P/E ratio)
Price-earning ratio (P/E ratio) indicates the amount that the investors are ready to pay for each rupee of the firm’s earnings. Investors or analysts calculate the price-earning ratio to find out whether the share of a company or firm is overvalued or undervalued as compared to its earning potential.
Formula to Calculate Price-Earning Ratio;
[latex]\mathrm{Price}-\mathrm{Earning}\;\mathrm{Ratio}=\frac{\mathrm{Market}\;\mathrm{price}\;\mathrm{per}\;\mathrm{share}}{\mathrm{Earning}\;\mathrm{price}\;\mathrm{per}\;\mathrm{share}}[/latex]Now the question arises of how to calculate Earning price per share (EPS). It is simple to calculate EPS through the following formula;
[latex]\mathrm{EPS}=\frac{\mathrm{Net}\;\mathrm{income}\;\mathrm{after}\;\mathrm{tax}-\mathrm{Preferred}\;\mathrm{stock}}{\mathrm{No}.\;\mathrm{of}\;\mathrm{outstanding}\;\mathrm{shares}}\\[/latex]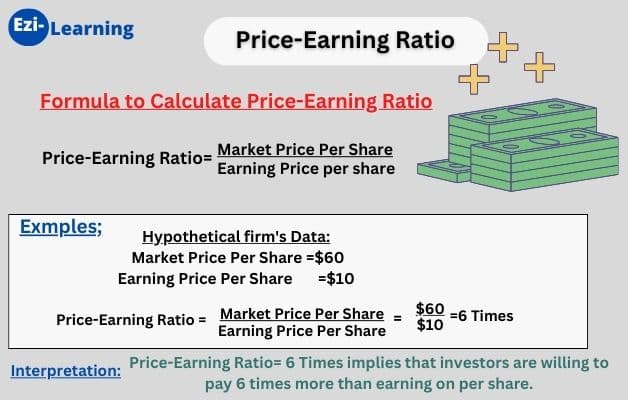
Interpretation: Price-Earning ratio= 6 Times implies that investors are willing to pay 6 times more than earning on its per share. In other words, investors are willing to pay $6 for every $1 of earnings that firms generate.
A higher ratio implies that the firm has significant prospects for future growth. It doesn’t mean that the firm is overvalued. It implies that the investor is expecting more than other firms on the market to this firm in the future. So if the firm had fewer earnings or almost no earnings, its P/E ratio would probably be quite large. Likewise; A low price-earning ratio indicates that the firm is undervalued or the company’s growth is uncertain in the future.
Market-to-Book ratio
The market-to-Book ratio measures how much investors are willing to pay for a company’s shares relative to its book value. It is calculated by dividing market value per share by book value per share. Notice that book value per share is total equity ( not just common stock) divided by the number of shares outstanding.
Formula to calculate Market-to-Book ratio:
[latex]\mathrm{Market}-\mathrm{to}-\mathrm{Book}\;\mathrm{value}\;\mathrm{Ratio}=\frac{\mathrm{Market}\;\mathrm{Price}\;\mathrm{Per}\;\mathrm{Share}}{\mathrm{Book}\;\mathrm{Value}\;\mathrm{Per}\;\mathrm{Share}}\\[/latex]
Interpretation: Market-to-Book value ratio= of 1.2 times implies that the investors are willing to pay 1.2 times more than the book value of the share of the particular firm. In other words, we also say the market-to-book value ratio=1.2 or 120% that investors are willing to pay an extra 20% premium over the company share in the sock market.
A higher market-to-book value ratio implies that the firm has significant prospects for future growth or greater competitive advantages than other similar firms or a favorable perception regarding firm earnings and vice-versa. If the ratio is greater than 1 (Market to Book value ratio>1) indicates that investors are willing to pay more amount of money (called the premium) to a firm’s share than its book value and vice-versa.
Downloading study materials related to this articles